Az MRTG telepĂtĂŠse
A HupWiki-bĹl...
TartalomjegyzĂŠk |
Az MRTG telepĂtĂŠse mini-HOWTO
Ez a dokumentum leĂrja, hogyan telepĂtsĂźk fel az MRTG-t Debian GNU/Linuxra.
Micskó Gåbor trey () hup ! hu - Hungarian Unix Portal v1.0 2001. július 31. kedd 9:17:16 - Copyright Š Hungarian Unix Portal
Mi is az az MRTG?
A Multi Router Traffic Grapher (MRTG) egy olyan program, amellyel monitorozni tudjuk egy hĂĄlĂłzati eszkĂśzĂśn ĂĄtmenĹ forgalmat. Az MRTG a hĂĄlĂłzati forgalombĂłl kĂźlĂśnbĂśzĹ szempontok alapjĂĄn HTML oldalakat kĂŠszĂt, amelyekben GIF kĂŠpekre rajzolja a grafikonokat. Az MRTG-t perl-ben ĂŠs C-ben ĂrtĂĄk, fut minden UNIX rendszeren. Eddig Solaris 8-on ĂŠs Linuxon teszteltem minden gond nĂŠlkĂźl. Az MRTG a mĹąkĂśdĂŠshez egy jĂłl portolhatĂł perlben Ărt SNMP implementĂĄciĂłt hasznĂĄl, ezĂŠrt hasznĂĄlatĂĄshoz nem szĂźksĂŠges semmilyen kĂźlsĹ SNMP csomag. Az MRTG tĂĄmogatja az Ăşj SNMPv2c 64 bites szĂĄmlĂĄlĂłkat. KĂśnnyen konfigurĂĄlhatĂł a hozzĂĄ adott konfigurĂĄcĂłs eszkĂśzĂśkkel. KellĹen gyors, mert a kritikus rutinokat ĂĄtĂrtĂĄk perl-bĹl C-re. A kĂŠpeket .png formĂĄtumĂşra kĂŠszĂti, ehhez a GD library-t hasznĂĄlja.
Az MRTG-vel kĂŠszĂthetĂźnk grafikont az elmĂşlt 5 perc ĂĄtlagĂĄbĂłl (daily view), az elmĂşlt 30 perc ĂĄtlagĂĄbĂłl (weekly view), az elmĂşlt 2 Ăłra ĂĄtlagĂĄbĂłl (monthly view), ĂŠs az elmĂşlt 1 nap ĂĄtlagĂĄbĂłl (yearly view). Az MRTG nem kizĂĄrĂłlag a Network Load-ot tudja analizĂĄlni, hanem az Ăśsszes SNMP esemĂŠnyt. Ha Ărsz hozzĂĄ kĂźlsĹ modult, akkor szinte bĂĄrmit monitorozhatsz: System Load, Login Session, Modem ĂĄllapot, CPU terhelĂŠs, Irc szerver kihasznĂĄltsĂĄg, HDD kapacitĂĄs, ĂŠs mĂŠg ezer dolog. A modulokat perl-ben cĂŠlszerĹą megĂrni, ĂŠs amint lĂĄtni fogjuk nagyon egyszerĹąen lehet ilyen modulokat fejleszteni.
A licenc
Az MRTG szabadon felhasznĂĄlhatĂł a GNU General Public License feltĂŠtelei mellett.
A telepĂtĂŠs
Az MRTG
A legfrissebb verziĂłt innen tĂśltheted le : http://ee-staff.ethz.ch/~oetiker/webtools/mrtg/pub/
Az MRTG forrĂĄskĂłdban tĂślthetĹ le, tehĂĄt hasznĂĄlat elĹtt le kell fordĂtani. Hogy ezt megtehessĂźk szĂźksĂŠg van egy C fordĂtĂłra (gcc) ĂŠs a gĂŠpen installĂĄlt perl-re.
Mivel Debiant hasznĂĄlunk :-) szerencsĂŠnk van. A Debian tartalmaz minden eszkĂśzt a telepĂtĂŠshez. MĂŠgis ha a legĂşjabb MRTG-re van szĂźksĂŠged, akkor tĂśltsd le a fenti linkrĹl.
TehĂĄt az installĂĄlĂĄs a kĂśvetkezĹkĂŠppen tĂśrtĂŠnik. A megfelelĹ sources.list beĂĄllĂtĂĄsa mellett:
# apt-get install mrtg
AjĂĄnlott mĂŠg: mrtg-contrib, httpd (mondjuk Apache) | www-browser (mondjuk links, lynx, Opera, Mozilla, stb.)
Ezeket kell nekĂźnk mĂŠg telepĂteni. A web browser meg arra kell, hogy a mĹąvĂźnket meg is tudjuk nĂŠzni. Ha a grafikonunkat a webre is ki szeretnĂŠnk helyezni, akkor telepĂtsĂźnk egy httpd-t is.
Az SNMP(d)
Ahhoz, hogy hasznĂĄljuk, kell egy SNMP daemon is. Az MRTG ugyan tartalmaz egy SNMP implementĂĄciĂłt, ĂŠn mĂŠgis azt javaslom, hogy telepĂtsĂźnk egyet.
- apt-get install snmpd
ez a parancs feltelepĂti az SNMP daemont a gĂŠpĂźnkre. Mivel a daemon biztosĂĄgi szempontbĂłl nincs beĂĄllĂtva - amire fel is hivja a figyelmĂźnket - konfigurĂĄlnunk kell. Ezt megtehetjĂźk a /etc/snmp/snmpd.conf szerkesztĂŠsĂŠvel.
KeressĂźk meg ezt a rĂŠszt:
##########################################################################
# Access Control
##########################################################################
....
....
##########################################################################
#
# First, map the community name (COMMUNITY) into a security name
# (local and mynetwork, depending on where the request is coming
# from):
# sec.name source community

com2sec paranoid default public
# com2sec readonly default public
# com2sec readwrite default private
Amint lĂĄtjuk a security alapbeĂĄllĂtĂĄsa 'paranoid', azaz ezzel sok mindent nem tudunk Ăgy kezdeni. Ahhoz, hogy az MRTG le tudja kĂŠrdezni, ĂĄt kell kissĂŠ Ărnunk:
# sec.name source community
# com2sec paranoid default public
com2sec readonly default public
#com2sec readwrite default private
TehĂĄt a default a 'com2sec readonly default public' legyen. TĂśbb jogot felesleges adnunk. Ha ĂĄtĂrtuk, mentsĂźk el a config-ot, majd /etc/init.d/snmpd restart parancsot adjuk ki bĂĄtran. Ez azĂŠrt kell, hogy az Ăşj beĂĄllĂtĂĄsok ĂŠrvĂŠnyesĂźljenek.
Ha ez megvan, minden olyan ĂśsszetevĹt telepĂtettĂźnk, amely az MRTG futtatĂĄsĂĄhoz, hasznĂĄlatĂĄhoz kell.
Az MRTG beĂĄllĂtĂĄsa
Az MRTG konfigurĂĄlĂĄsa kicsit nehezebb dolog. Ez mindig az adott konfigurĂĄciĂłtĂłl fĂźgg. Ăn most egy standalone gĂŠp ppp0, eth0, vmnet1 csatolĂłjĂĄt fogom monitorozni. TermĂŠszetesen az MRTG kĂŠpes a ppp0, ippp0, stb. interface-ket is monitorozni. A beĂĄllĂtĂĄsok nem sokban tĂŠrnek el egymĂĄstĂłl.
Ahhoz hogy az MRTG mĹąkĂśdni tudjon, szĂźksĂŠg van egy mrtg.cfg file-ra (lehet mĂĄs is a neve). Ezt ĂĄltalĂĄban a /etc/mrtg.cfg helyen talĂĄlod. Ez a file az installĂĄlĂĄs utĂĄn mĂŠg nem lĂŠtezik, neked kell legyĂĄrtani. Ehhez a 'cfgmaker' nevĹą programot fogjuk hasznĂĄlni, amelyet az MRTG-vel szĂĄllĂtanak. Az elsĹ dolog a router-Ăźnk (szerverĂźnk) Target-jĂŠt meghatĂĄrozzuk. A Target mondja meg az MRTG-nek mit is kell monitorozni. Pl:
Target[valamigep.valahol.hu]: 2:[email protected]
TehĂĄt:
cfgmaker 2:[email protected] >> mrtg.cfg
ezzel a configfile jĂł esetben el is kĂŠszĂźlt. Itt az IP cĂm a ppp0 interface IP-je.
Egy pĂŠlda az mrtg.cfg -re:
---------------------------------X----X-----------------------------------
WorkDir: /var/www/mrtg
WriteExpires: Yes
#########################################################################
# System: sunshine
# Description: Linux sunshine 2.4.6 #2 Sun Jul 8 13:46:40 CEST 2001 i686
# Contact: Root <root@localhost> (configure /etc/snmp/snmp.local.conf)
# Location: Unknown (configure /etc/snmp/snmp.local.conf)
#########################################################################
### Interface 1 >> Descr: 'lo' | Name:  | Ip: '127.0.0.1' | Eth:  ###
### The following interface is commented out because:
### * it is a Software Loopback interface
#
# Target[195.56.26.224_1]: 1:[email protected]:
# SetEnv[195.56.26.224_1]: MRTG_INT_IP="127.0.0.1" MRTG_INT_DESCR="lo"
# MaxBytes[195.56.26.224_1]: 1250000
# Title[195.56.26.224_1]: Traffic Analysis for 1 -- sunshine
# PageTop[195.56.26.224_1]: <H1>Traffic Analysis for 1 -- sunshine</H1>
# <TABLE>
# <TR><TD>System:</TD> <TD>sunshine in Unknown (configure /etc/snmp/snmp.local.conf)</TD></TR>
# <TR><TD>Maintainer:</TD> <TD>Root <root@localhost> (configure /etc/snmp/snmp.local.conf)</TD></TR>
# <TR><TD>Description:</TD><TD>lo </TD></TR>
# <TR><TD>ifType:</TD> <TD>softwareLoopback (24)</TD></TR>
# <TR><TD>ifName:</TD> <TD></TD></TR>
# <TR><TD>Max Speed:</TD> <TD>1250.0 kBytes/s</TD></TR>
# <TR><TD>Ip:</TD> <TD>127.0.0.1 (trey.hu)</TD></TR>
# </TABLE>
### Interface 2 >> Descr: 'eth0' | Name: | Ip: '10.0.0.1' | Eth: '00-08-c7-ea-7a-4b' ###
Target[195.56.26.224_2]: 2:[email protected]:
SetEnv[195.56.26.224_2]: MRTG_INT_IP="10.0.0.1" MRTG_INT_DESCR="eth0"
MaxBytes[195.56.26.224_2]: 1250000
Title[195.56.26.224_2]: Traffic Analysis for 2 -- sunshine
PageTop[195.56.26.224_2]: <H1>Traffic Analysis for 2 -- sunshine</H1>
<TABLE>
<TR><TD>System:</TD> <TD>sunshine in Unknown (configure /etc/snmp/snmp.local.conf)</TD></TR>
<TR><TD>Maintainer:</TD> <TD>Root <root@localhost> (configure /etc/snmp/snmp.local.conf)</TD></TR>
<TR><TD>Description:</TD><TD>eth0 </TD></TR>
<TR><TD>ifType:</TD> <TD>ethernetCsmacd (6)</TD></TR>
<TR><TD>ifName:</TD> <TD></TD></TR>
<TR><TD>Max Speed:</TD> <TD>1250.0 kBytes/s</TD></TR>
<TR><TD>Ip:</TD> <TD>10.0.0.1 (sunshine.trey.hu)</TD></TR>
</TABLE>
### Interface 3 >> Descr: 'vmnet1' | Name: | Ip: '10.0.0.2' | Eth: '00-50-56-01-00-00' ###
Target[195.56.26.224_3]: 3:[email protected]:
SetEnv[195.56.26.224_3]: MRTG_INT_IP="10.0.0.2" MRTG_INT_DESCR="vmnet1"
MaxBytes[195.56.26.224_3]: 1250000
Title[195.56.26.224_3]: Traffic Analysis for 3 -- sunshine
PageTop[195.56.26.224_3]: <H1>Traffic Analysis for 3 -- sunshine</H1>
<TABLE>
<TR><TD>System:</TD> <TD>sunshine in Unknown (configure /etc/snmp/snmp.local.conf)</TD></TR>
<TR><TD>Maintainer:</TD> <TD>Root <root@localhost> (configure /etc/snmp/snmp.local.conf)</TD></TR>
<TR><TD>Description:</TD><TD>vmnet1 </TD></TR>
<TR><TD>ifType:</TD> <TD>ethernetCsmacd (6)</TD></TR>
<TR><TD>ifName:</TD> <TD></TD></TR>
<TR><TD>Max Speed:</TD> <TD>1250.0 kBytes/s</TD></TR>
<TR><TD>Ip:</TD> <TD>10.0.0.2 ()</TD></TR>
</TABLE>
### Interface 4 >> Descr: 'ppp0' | Name:  | Ip: '195.56.26.224' | Eth:  ###
### The following interface is commented out because:
### * has a speed of 0 which makes no sense
#
# Target[195.56.26.224_4]: 4:[email protected]:
# SetEnv[195.56.26.224_4]: MRTG_INT_IP="195.56.26.224" MRTG_INT_DESCR="ppp0"
# MaxBytes[195.56.26.224_4]: 0
# Title[195.56.26.224_4]: Traffic Analysis for 4 -- sunshine
# PageTop[195.56.26.224_4]: <H1>Traffic Analysis for 4 -- sunshine</H1>
# <TABLE>
# <TR><TD>System:</TD> <TD>sunshine in Unknown (configure /etc/snmp/snmp.local.conf)</TD></TR>
# <TR><TD>Maintainer:</TD> <TD>Root <root@localhost> (configure #/etc/snmp/snmp.local.conf)</TD></TR>
# <TR><TD>Description:</TD><TD>ppp0 </TD></TR>
# <TR><TD>ifType:</TD> <TD>ppp (23)</TD></TR>
# <TR><TD>ifName:</TD> <TD></TD></TR>
# <TR><TD>Max Speed:</TD> <TD>0.0 Bytes/s</TD></TR>
# <TR><TD>Ip:</TD> <TD>195.56.26.224 (gyor-1.dialin.datanet.hu)</TD></TR>
# </TABLE>
Target[localhost.cpu]: `/home/trey/cpuinfo.pl`
MaxBytes[localhost.cpu]: 100
Options[localhost.cpu]: gauge, nopercent
Unscaled[localhost.cpu]: dwym
YLegend[localhost.cpu]: % of CPU used
ShortLegend[localhost.cpu]: %
LegendO[localhost.cpu]:  CPU System:
LegendI[localhost.cpu]:  CPU User:
Title[localhost.cpu]: localhost.cpu name
PageTop[localhost.cpu]: <H1>CPU usage for localhost.cpu name</H1>
<TABLE>
<TR><TD>System:</TD> <TD>Debian GNU/LiNUX 2.2</TD></TR>
<TR><TD>Maintainer:</TD> <TD>System administrator</TD></TR>
<TR><TD>Description:</TD><TD>Intel Pentium III</TD></TR>
<TR><TD>Ip:</TD> <TD>localhost (debian)</TD></TR>
</TABLE>
---------------------------------X----X-----------------------------------
Ahol a 'WorkDir: /var/www/mrtg' ahova az MRTG dolgozik. A config file elsĹ szakaszĂĄban a 'lo' azt jelenti, hogy a localhost-ot monitorozza. AzutĂĄn kĂśvetkezik a tĂśbbi interface: az 'eth0', vmnet1, ppp0, ĂŠs vĂŠgĂźl egy kĂźlsĹ modul segĂtsĂŠgĂŠvel a gĂŠp CPU-jĂĄnak terhelĂŠsĂŠt mĂŠrjĂźk. Itt jĂłl lĂĄthatĂł, hogy mikĂŠnt tudunk egy ĂĄltalunk Ărt modult futtatni. A `/home/trey/cpuinfo.pl` egy perl script amit nekĂźnk kell megĂrni, vagy beszerezni.
---------------------------------X----X-----------------------------------
#!/usr/bin/perl
# Script modified by trey
# Succesfully tested on this systems:
# Solaris8 x86
# Debian GNU/Linux 2.2potato, 2.3 Woody unstable
#========================================================
# CPU Usage script for mrtg
#
# File: cpuinfo.pl
# Author: Matthew Schumacher | [email protected]
# Version: 1.0
#
# Date: 10/15/1999
# Purpose: This script reports CPU usage for user
# and system to mrtg, along with uptime
# and the machine's hostname.
#
# Usage: ./cpuinfo.pl {machine} {os}
#
# For now {os} can only be "sun" or "linux"
#
# If you would like to hard code defaults
# then enter them below.
#
# Info: Designed on RedHat linux 6.0 with perl
# version 5.004_04. The script itself has
# only been tested on Linux, however, it
# has been tested to connect to, and graph
# CPU usage on sun (solaris 7) and linux.
#
# This script requires both sar and rsh to
# be installed and working. Because linux
# does not come with sar (mine didn't) it
# may be necessary to download and install
# it. Get it here:
#
# ftp://metalab.unc.edu/pub/Linux/system/status/sysstat-2.0.tar.gz
#
#
# How it works:
#
# The script uses rsh to run sar on the the
# remote machine. Sar samples the cpu time
# for both user and system once per second
# for 10 seconds. It then reports an average
# to the script, which parses out the information
# and formats it in a way mrtg can understand.
# The script also runs uptime to get the machine's
# uptime and passes it to mrtg.
#
# [Note to User]
#
# If anyone has comments or suggestions, email me at
# [email protected] and I'll try to get back to you :)
#
# -------------------------------------------------------------
#
# Sample cfg:
#
# Target[machine]: `./cpuinfo.pl`
# MaxBytes[machine]: 100
# Options[machine]: gauge, nopercent
# Unscaled[machine]: dwym
# YLegend[machine]: % of CPU used
# ShortLegend[machine]: %
# LegendO[machine]:  CPU System:
# LegendI[machine]:  CPU User:
# Title[machine]: Machine name
# PageTop[machine]: >H1<CPU usage for Machine name
# >/H1<
# >TABLE<
# >TR<>TD<System:>/TD<>TD<Machine name>/TD<>/TR<
# >/TABLE<
#
# --------------------------------------------------------------
#
# Ok, we are now done with the notes :)
#
#========================================================
# setup local vars
my($machine, $os);
#=======================================================
# == Enter your default machine name and os here ==
$machine = "195.56.253.245";  # Enter machine to monitor here
$os = "sun";  # Currently there is only linux and sun
# == You shouldn't need to edit anything below this line ==
#========================================================
# This allows command args to override defaults listed above
if (scalar(@ARGV) < 2)
{
print("USAGE: cpuinfo.pl {machine} {os}\n");
exit(-1);
}
if ($ARGV[0] ne  && $ARGV[0] ne ' #')
{
$machine = $ARGV[0];
}
if ($ARGV[1] ne  && $ARGV[1] ne ' #')
{
$os = $ARGV[1];
}
# Validate the os
SWITCH:
{
if ($os =~ /^sun$/){last SWITCH;}
if ($os =~ /^linux$/){last SWITCH;}
# DEFAULT: Die if we can't figure out what the os is
die "Can't figure out which OS the machine is.\n";
}
# Execute the appropriate subroutine based on the os
&$os;
exit(0);
#=======================================================
# Subroutines: names of subroutines are supported OSs.
#========================================================
sub sun
{
# Run commands
# $getcpu = `rsh $machine "sar -u 1 10" | grep Average`;
# $getuptime = `rsh $machine "uptime"`;
$getcpu = `sar -u 1 40 | grep Average`;
$getuptime = `uptime`;
# Parse though getcpu and get data
$getcpu =~ /^Average\s+(\d+)\s+(\d+)\s+/;
$outputusr = $1;
$outputsys = $2;
# Print getcpu data for mrtg
print $outputusr."\n";
print $outputsys."\n";
# Parse though getuptime and get data
$getuptime =~ /^\s+(\d{1,2}:\d{2}..)\s+up\s+(\d+)\s+(......),/;
# Print getuptime data for mrtg
print $2." ".$3."\n";
# Print machine name for mrtg
print $machine."\n";
}
sub linux
{
# Run commands
# $getcpu = `rsh $machine "/usr/local/bin/sar -u 1 10 | grep "Average:""`;
# $getuptime = `rsh $machine "/usr/bin/uptime"`;
$getcpu = `/usr/local/bin/sar -u 1 10 | grep "Average:"`;
$getuptime = `/usr/bin/uptime`;
# Parse though getcpu and get data
$getcpu =~ /^Average:\s+(\d+).(\d+)%\s+(\d+).(\d+)%\s+(\d+).(\d+)%\s+(\d+).(\d+)%/;
$getcpuusr = $1;
$getcpusys = $5;
# Print getcpu data for mrtg
print $getcpuusr."\n";
print $getcpusys."\n";
# Parse though getuptime and get data
$getuptime =~ /^\s+(\d{1,2}:\d{2}..)\s+up\s+(\d+)\s+(\w+),/;
# Print getuptime data for mrtg
print $2." ".$3."\n";
# Print machine name for mrtg
print $machine."\n";
}
---------------------------------X----X-----------------------------------
Hogyan futtassuk az MRTG-t?
Mivel szeretnĂŠnk ha a Network Load-ot, CPU terhelĂŠst, stb. folyamatosan nyomon kĂśvethetnĂŠnk (csak ennek van ĂŠrtelme), szĂźksĂŠges az MRTG-t crontab-ba tenni (lehet daemon-kĂŠnt is futtatni, ehhez olvasd el a /usr/doc/mrtg kĂśnyvtĂĄrban levĹ dokumentĂĄciĂłt. Meg amĂşgyis : RTFM).
editĂĄljuk a /etc/crontab file -t, ĂŠs irjuk bele az alĂĄbbi sort:
5,10,15,20,25,30,35,40,45,50,55 * * * * /usr/bin/mrtg /etc/mrtg.cfg > /dev/null 2>&1
Ez azt, teszi hogy minden nap, minden ĂśtĂśdik percben lefuttatja az MRTG -t, ĂŠs elkĂŠszĂti a grafikonokat.
MintĂĄk
Itt kĂŠt mintĂĄt lĂĄthatsz az MRTG kimenetĂŠbĹl. MielĹtt valaki ĂśsszefĂźggĂŠst keresne a fenti config file, ĂŠs az itt lĂĄthatĂł kĂŠpek kĂśzĂśtt, elmondom, hogy ezek a kĂŠpek nem a fenti configfile alapjĂĄn kĂŠszĂźltek :-).
Traffic Analysis debian.szintezis.hu
| System: | SunOS 5.8 aka. Solaris 8 |
| Maintainer: | System administrator |
| Description: | iprb0 |
| ifType: | ethernetCsmacd (6) |
| ifName: | Intel 100pro/Compaq Netelligent |
| Max Speed: | 17.0 kBytes/s |
| Ip: | 195.56.253.245 (debian) |
The statistics were last updated Tuesday,
31 July 2001 at 11:20,
at which time 'debian' had been up for 93
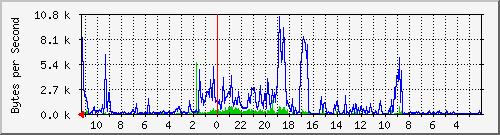
`Daily' Graph (5 Minute Average)
http://www.hup.hu/old/mrtg_howto/debian.szintezis.hu_2-day.png
| Max In: | 5675.0 B/s (33.4%) | Average In: | 205.0 B/s (1.2%) | Current In: | 360.0 B/s (2.1%) | ||
| Max Out: | 10.5 kB/s (61.9%) | Average Out: | 1024.0 B/s (6.0%) | Current Out: | 7691.0 B/s (45.2%) |
`Weekly' Graph (30 Minute Average)
http://www.hup.hu/old/mrtg_howto/debian.szintezis.hu_2-week.png
| Max In: | 8898.0 B/s (52.3%) | Average In: | 471.0 B/s (2.8%) | Current In: | 61.0 B/s (0.4%) | ||
| Max Out: | 14.7 kB/s (86.2%) | Average Out: | 1769.0 B/s (10.4%) | Current Out: | 390.0 B/s (2.3%) |
`Monthly' Graph (2 Hour Average)
http://www.hup.hu/old/mrtg_howto/debian.szintezis.hu_2-month.png
| Max In: | 4997.0 B/s (29.4%) | Average In: | 318.0 B/s (1.9%) | Current In: | 69.0 B/s (0.4%) | ||
| Max Out: | 14.2 kB/s (83.7%) | Average Out: | 1596.0 B/s (9.4%) | Current Out: | 209.0 B/s (1.2%) |
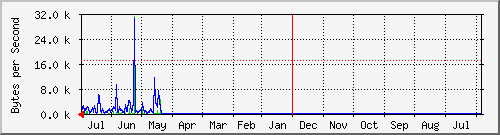
`Yearly' Graph (1 Day Average)
http://www.hup.hu/old/mrtg_howto/debian.szintezis.hu_2-year.png"
| Max In: | 31.4 kB/s (184.5%) | Average In: | 846.0 B/s (5.0%) | Current In: | 246.0 B/s (1.4%) | ||
| Max Out: | 30.6 kB/s (180.2%) | Average Out: | 2277.0 B/s (13.4%) | Current Out: | 1194.0 B/s (7.0%) |
| GREEN ### | Incoming Traffic in Bytes per Second |
| BLUE ### | Outgoing Traffic in Bytes per Second |
| http://www.hup.hu/old/mrtg_howto/mrtg-l.png | http://www.hup.hu/old/mrtg_howto/mrtg-m.png | http://www.hup.hu/old/mrtg_howto/mrtg-r.png |
| version 2.9.10 | Tobias Oetiker [email protected] and Dave Rand [email protected] |
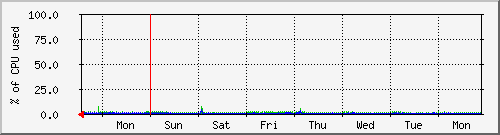
CPU usage for debian.szintezis.hu name
| System: | SunOS 5.8 aka. Solaris 8 |
| Maintainer: | System administrator |
| Description: | Intel Pentium Pro 200 dual |
| Ip: | 195.56.253.245 (debian) |
The statistics
were last updated Tuesday, 31 July 2001 at 11:20,
at which time '195.56.253.245'
had been up for 93 day(s).
`Daily' Graph (5 Minute Average)
http://www.hup.hu/old/mrtg_howto/debian.szintezis.hu-day.png
| Max CPU User: | 29.0 % | Average CPU User: | 3.0 % | Current CPU User: | 1.0 % | ||
| Max CPU System: | 5.0 % | Average CPU System: | 1.0 % | Current CPU System: | 1.0 % |
`Weekly' Graph (30 Minute Average)
http://www.hup.hu/old/mrtg_howto/debian.szintezis.hu-week.png
| Max CPU User: | 8.0 % | Average CPU User: | 1.0 % | Current CPU User: | 2.0 % | ||
| Max CPU System: | 4.0 % | Average CPU System: | 0.0 % | Current CPU System: | 1.0 % |
`Monthly' Graph (2 Hour Average)
http://www.hup.hu/old/mrtg_howto/debian.szintezis.hu-month.png
| Max CPU User: | 8.0 % | Average CPU User: | 1.0 % | Current CPU User: | 2.0 % | ||
| Max CPU System: | 2.0 % | Average CPU System: | 0.0 % | Current CPU System: | 1.0 % |
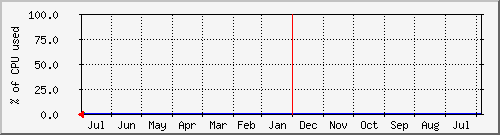
`Yearly' Graph (1 Day Average)
http://www.hup.hu/old/mrtg_howto/debian.szintezis.hu-year.png
| Max CPU User: | 2.0 % | Average CPU User: | 1.0 % | Current CPU User: | 2.0 % | ||
| Max CPU System: | 0.0 % | Average CPU System: | 0.0 % | Current CPU System: | 0.0 % |
| GREEN ### | Incoming Traffic in Bytes per Second |
| BLUE ### | Outgoing Traffic in Bytes per Second |
| http://www.hup.hu/old/mrtg_howto/mrtg-l.png | http://www.hup.hu/old/mrtg_howto/mrtg-m.png | http://www.hup.hu/old/mrtg_howto/mrtg-r.png |
| version 2.9.10 | Tobias Oetiker [email protected] and Dave Rand [email protected] |
KapcsolĂłdĂł linkek
Az MRTG hivatalos honlapja: http://ee-staff.ethz.ch/~oetiker/webtools/mrtg/mrtg.html
Az MRTG FAQ oldalĂĄt itt talĂĄlod: http://faq.mrtg.org/
Hogyan mĹąkĂśdik az SNMP? A vĂĄlaszt itt talĂĄlod: http://www.develnet.es/~david/papers/snmp/
VĂŠgszĂł
Ennyit rĂśviden az MRTG telepĂtĂŠsĂŠrĹl. TermĂŠszetesen ez a leĂrĂĄs a minimĂĄlis lehetĹsĂŠgeket ismerteti. Amennyiben extra kĂvĂĄnsĂĄgod van, lĂĄtogass el az MRTG oldalĂĄra, ĂŠs olvasd el a dokumentĂĄciĂłt. A weboldalon nagyon jĂłl dokumentĂĄlva van minden.
Copyright, licenc, visszajelzĂŠs ĂŠs ilyesmi
MicskĂł GĂĄbor trey () hup ! hu - Hungarian Unix Portal - http://www.hup.hu/
Ez a dokumentum szabadon mĂĄsolhatĂł ĂŠs terjeszthetĹ a GNU GPL terjesztĂŠsi feltĂŠtelei szerint.
Garancia nincs.
VisszajelzĂŠseket, ĂŠpĂtĹ jellegĹą kritikĂĄt a trey () hup ! hu email cĂmre vĂĄrok.
Sok szerencsĂŠt!
